Abstract
The behavior of the antenna at the onset of collapse of the North Tower (WTC 1) has significant implications for understanding the building’s destruction. If the antenna fell straight down into the building at the onset of collapse, prior to the descent of the perimeter walls, it would indicate that the supporting core columns would have had to fail first. No plausible mechanism for this failure, apart from demolition, has been proposed. NIST proposes, however, that we are not actually seeing the antenna “fall.” Rather a failure in the south wall propagated to the core columns causing the top section of the building to tip southward, producing the illusion of a dropping antenna when viewed from the north side of the building. The purpose of this paper is to establish by careful measurements whether the initial downward motion of the antenna was real or simply an illusion.
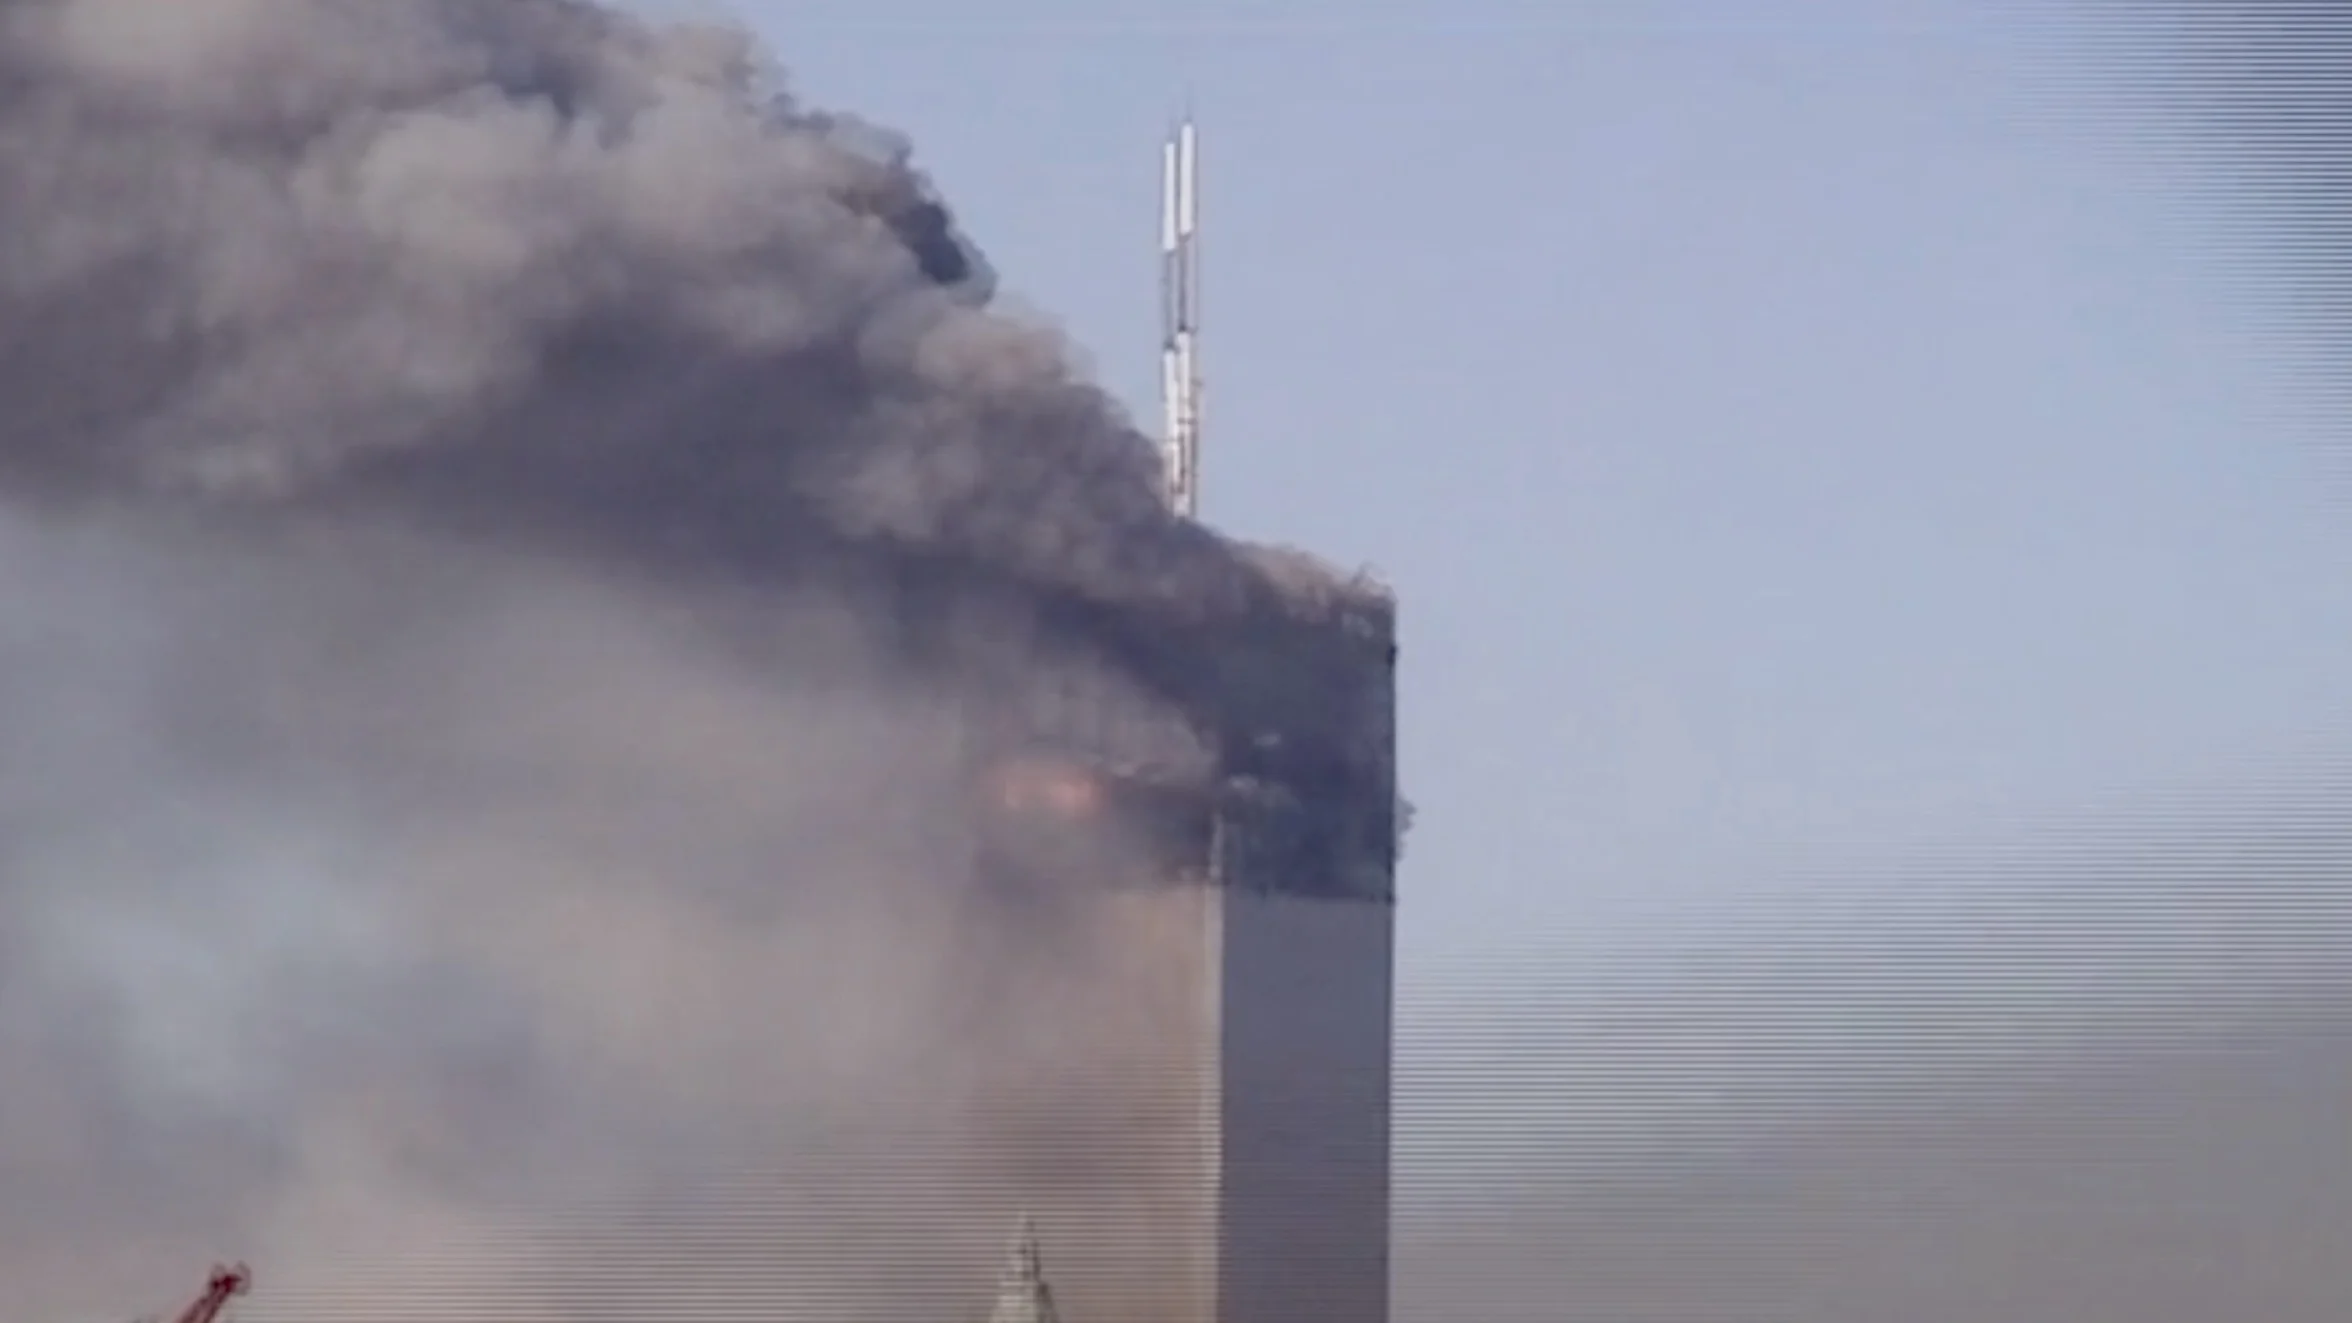
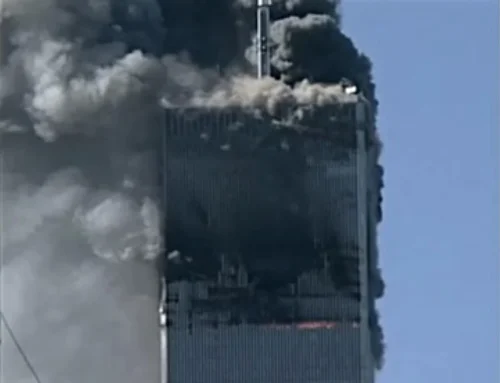
A well-known video by Etienne Sauret showing the initiation of collapse of the North Tower of the World Trade Center[1] appears to show the antenna dropping straight downward a fraction of a second before the perimeter roofline. Measurements of the antenna’s motion based on this video have been called into question because as seen from partial side views, the antenna can be seen to tilt to the south.
To assess the significance of the tipping motion, measurements have been made which show that in the first 1.6 seconds of the collapse the amount of antenna tilt is very small compared with its vertical motion, from which we conclude that the perimeter wall drop and the antenna rotation motion are not coupled. This leads to the conclusion that the vertical motion of the antenna at the onset of collapse is real. This is consistent with the demolition hypothesis and also with the findings of the initial FEMA report.
Question of the Leaning Antenna
Dr. Steven E. Jones, in his seminal paper “Why Indeed Did the WTC Buildings Completely Collapse?”, references the cursory and contradictory analyses by FEMA and NIST of the early fall of the large transmission antenna on the top of WTC 1 (the North Tower). He quotes them as follows[2]:
FEMA: “Review of videotape recordings of the collapse taken from various angles indicates that the transmission tower on top of the structure began to move downward and laterally slightly before movement was evident at the exterior wall. This suggests that collapse began with one or more failures in the central core area of the building. (FEMA, 2002, chapter 2; emphasis added.)”
A straight down fall of the antenna is problematic to the NIST collapse sequence scenario with the core failing first rather than the perimeter columns. After the FEMA/ASCE report was developed, NIST addressed the antenna motion reversing what FEMA/ASCE proposed.
NIST: “…photographic and videographic records taken from due north of the WTC 1 collapse appeared to indicate that the antenna was sinking into the roof {McAllister 2002}. When records from east and west vantage points were viewed, it was apparent that the building section above the impact area tilted to the south as the building collapsed. (NIST, 2005)”
Dr. Jones continues: “However, we find no quantitative analysis in the report which shows that this tilting of the building section was sufficient to account for the large apparent drop of the antenna as seen from the north, or that this building-section-tilting occurred before the apparent antenna drop.
Mechanical engineer Tony Szamboti, in his paper “25 Areas of Specific Concern in the NIST WTC Reports,” states[3]:
“The NIST report claims that WTC 1 tilted 8° to the south and then began its descent. There is no analysis provided to back this assertion. Analyses of video by individual researchers have shown only a very small tilt of 1° or less prior to the descent of the upper 12 stories, and only after at least a two-story vertical drop was there a larger tilt of 8° to the south. Most or all of the columns on the 98th floor, where the collapse initiated, must have failed simultaneously in order to allow the initial symmetrical descent at two-thirds of free-fall acceleration, destroying the upper 12-story block in the first four seconds. The only mechanism available for such destruction or failure of columns is timed-sequenced explosives — typical in controlled implosions. This sudden collapse, which could only have been the result of instantaneous column destruction, also refutes the NIST assertion that a south wall failure precipitated a gradual south-to-north failure.”
In 2009 Ryan Mackey, attempting to refute Szamboti’s “Missing Jolt” analysis[4], cited a still image extracted from video footage from a camera angle looking at the east side of the building that shows the antenna tipping dramatically southward.[5] In that debate Szamboti correctly pointed out that Mackey’s image was from a frame several seconds into the collapse, so it did not represent the start of the fall. Szamboti argued that the antenna’s motion was initially vertical and only later tilted. (Our tracking of the antenna’s motion in Appendix D supports Szamboti’s claims.)
More recently Sabin Mathew, in a debate with Jonathan Cole and Ted Walter (Dec. 8, 2023), repeated NIST’s claim that video taken from the north is not reliable due to the hidden southward tilt of the antenna and that the antenna did not actually begin to fall prior to the roofline[6]. A quantitative analysis of the antenna drop/tilt has been a lingering loose end in the understanding of the collapse initiation of the North Tower. Given the long history of this debate, it is time to do some careful measurements to lay the questions to rest.
Measurement of the Antenna Motion
A commonly used video for studying the initial descent of the North Tower is one captured by Etienne Sauret showing the top section of the tower and the lower part of the television broadcasting antenna on its roof.[7] The camera is almost squarely facing the nominal north side of the building. The dropping antenna and perimeter roofline (along with sections of perimeter columns in the upper block of the building) are the first signs of downward motion at the onset of the fall of the building. If the antenna and roof move vertically downward through the structure of the building from the very start of the motion, it would be evidence that all of the core columns under them were simultaneously compromised by some mechanism other than crushing, e.g., explosive charges.
One difficulty in measuring the southward tilt of the antenna is that most video footage of the collapse of the North Tower is from cameras looking at the north face of the building. However, a few videos from other angles exist. A video labeled “Main & Ballou 17”[8], which was released by NIST under FOIA as part of the Cumulus database, has a camera angle greater than 45° toward the east face. (This is the video from which Mackey’s single still frame was extracted.)

Since the antenna does not appear to tip in the early stages of the collapse, when viewed from the nominal north side, as in the Sauret video, it can be inferred that the actual plane of rotation of the antenna is directly toward the south face of the building. Some have pointed out that the antenna does tip somewhat toward the east, but that is later in the fall and does not affect our assessment of collapse initiation. Based on a plane of rotation toward the south wall and the horizontal camera angle strongly toward the east, the actual angle of the antenna in its plane of rotation can be computed as a function of time. The sequence of calculations needed to accomplish this correction is as follows.
- The horizontal camera angle, measured from “nominal north” (relative to the building orientation) must be computed. The approach used for this analysis is to “fold” the top view of the roof onto the front view of the building, matching the corners of the top view with the corresponding edges of the front view of the building. The desired angle can then be measured directly. This is accomplished using a quantitative graphical tool, GeoGebra.[9] (See Appendix B.)
- A transformation is then derived to convert the apparent angle of tilt, in the film plane of the camera, to the true angle of tilt in its plane of rotation. (See Appendix C.)
- The apparent tilt of the antenna is then measured as a function of time using “Tracker,” available as free software from the Open Source Physics project.[10] The camera angle from Appendix B and the transformation derived in Appendix C are used to find the true angle of tilt as a function of time. (See Appendix D.)
- A pivoting of the roof-antenna complex would cause some downward motion of the antenna. The question is whether the measured downward motion of the antenna exceeds the downward component of such a rotation. If the downward motion of the antenna exceeds the vertical component of the rotation of the roof-antenna complex, we can conclude that the antenna is dropping due to removal of support in the core structure of the building. (See Appendix E.)
Conclusions
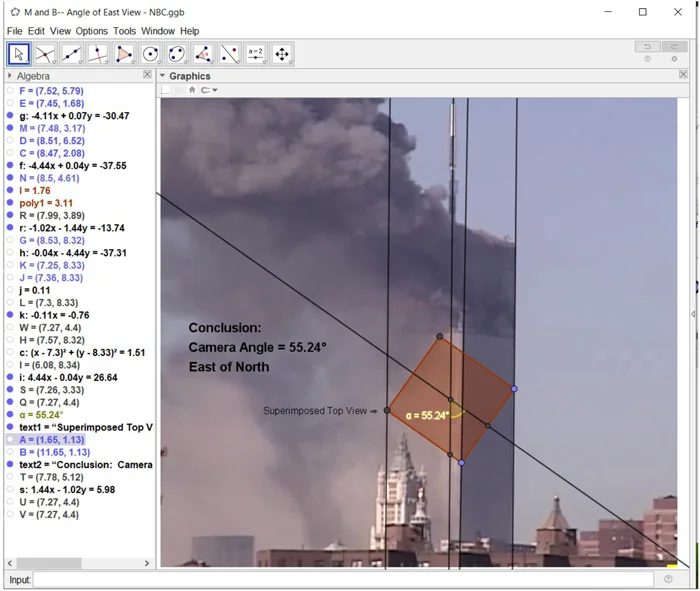
- The “Main & Ballou 17” video was used in these measurements. For this video the horizontal camera angle, relative to nominal north (referred to herein as α) was found in Appendix B to be 55.24°.
- From Appendix C, we have that if
α is the horizontal camera angle,
θ is the apparent angle of antenna tilt in the film plane of the camera,
and ϕ is the angle of tilt in the actual plane of rotation,
then tan ϕ = tan θ / sin α. This transforms the apparent angle of tilt (in the film plane) to the actual angle of tilt (in the plane of rotation). This transformation is carried out for each antenna-angle measurement in the spreadsheet in Appendix D. - From Appendix D we can see that the tilt of the antenna remains less than 1° until after the initiation of downward motion of the antenna. Since the building is stationary at this time, we can assume that the small variations we are seeing are due to measurement uncertainties.
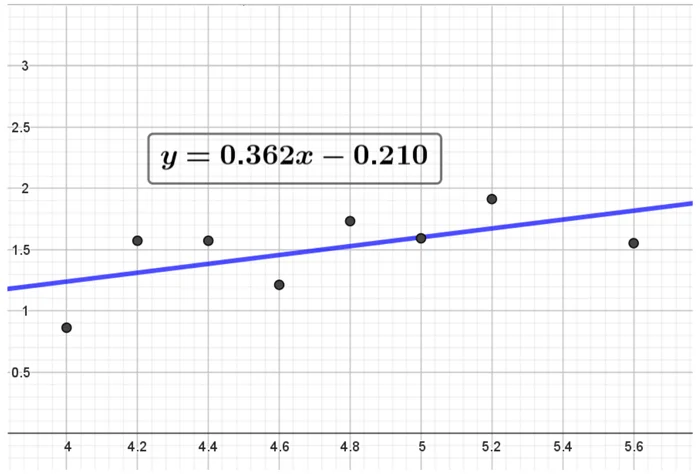
- From Appendix E we see that the antenna rotated only about 0.58° during the first 1.6 sec of its fall. This corresponds to a drop of no more than 32 cm. However, the measured drop during this interval was 5.71 m. Therefore, the vertical motion of the antenna cannot be accounted for by the rotation of the roof-antenna complex.
- NIST has proposed that, given the tilting of the antenna, the initial motion of the building would be better characterized as a southward rotation of the roof-antenna complex, triggered by a failure of perimeter columns along the south wall that propagated progressively through the core of the building. This would give the illusion of an initial downward motion of the antenna preceding the downward motion of the north perimeter wall. This hypothesis is amenable to testing when expressed quantitatively. If the apparent initial downward motion of the antenna were due to a rotation of the roof, the amount of apparent downward motion would be limited to the vertical component of the roof’s rotation, as measured at the base of the antenna. From Appendix E we see that the antenna rotated only about 0.58° during the first 1.6 sec of its fall. This corresponds to a drop of no more than 32 cm. However, the measured drop during this interval was 5.71 m. Therefore, the vertical motion of the antenna cannot be accounted for by the rotation of the roof-antenna complex. We can conclude that the drop of the antenna, preceding the drop of the north face perimeter wall, is real, not an illusion.
- The antenna dropping through the core of the building would require the near simultaneous prior failure of all of the structural elements supporting it. This is something that would be expected in a demolition but not in a progressive sequence of column failures as suggested by NIST.
Appendix A
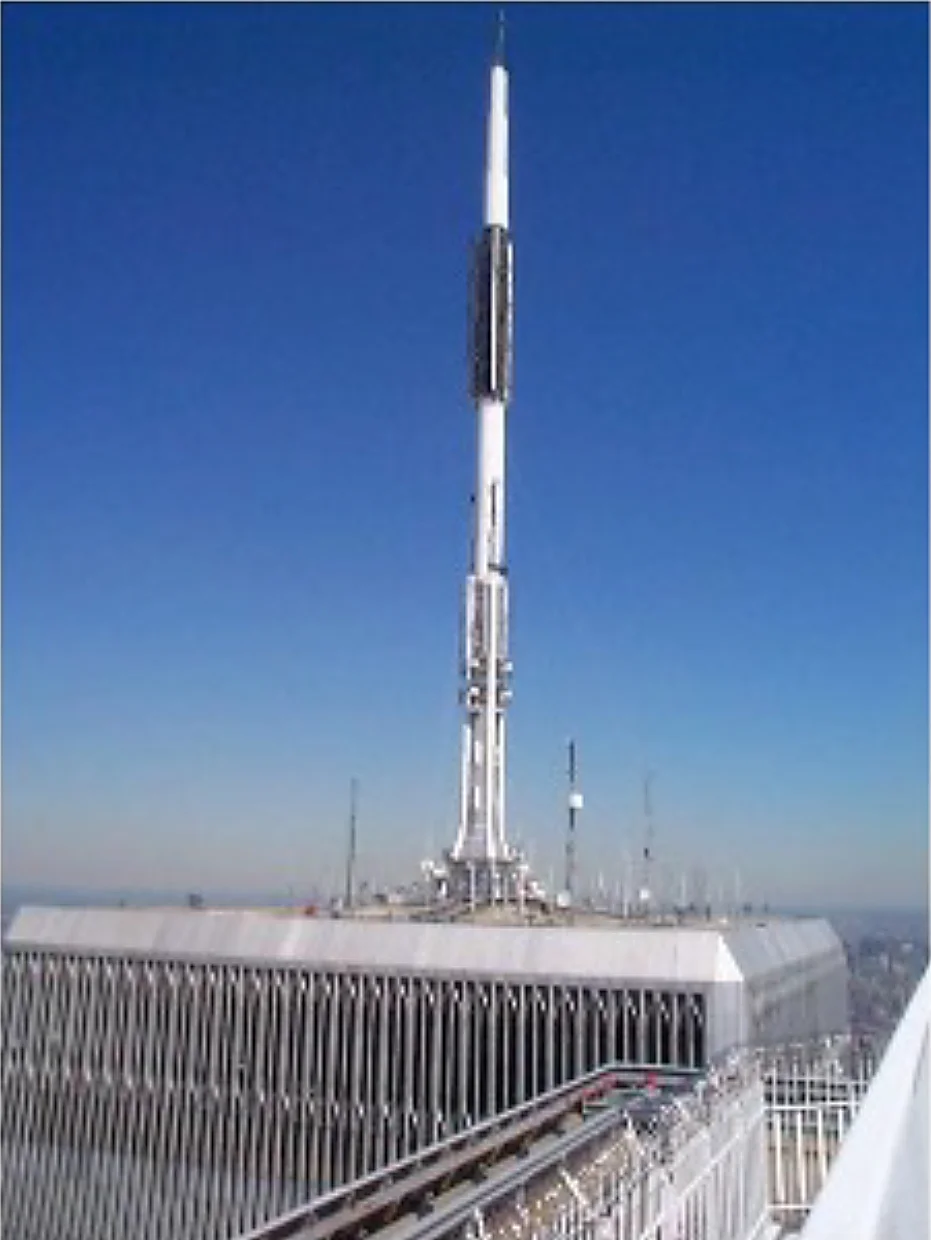
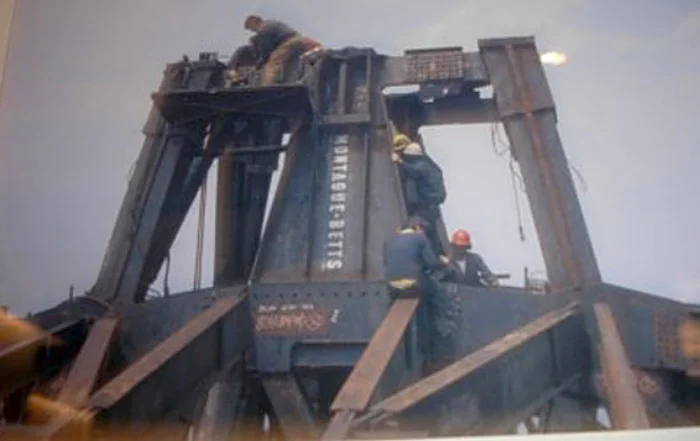
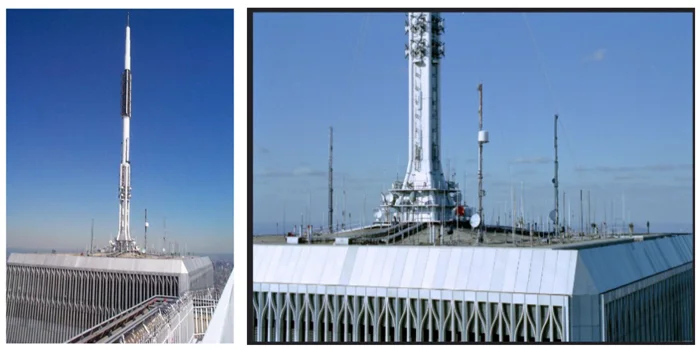
Some background on the support system for the antenna is in order. The antenna is mounted to a heavy base structure, Figure 4, which is in turn mounted to the hat truss, Figures 5 and 6, which ties together the tops of the core columns. Several outriggers in each direction, Figure 5, form a bridge to the system of perimeter columns.
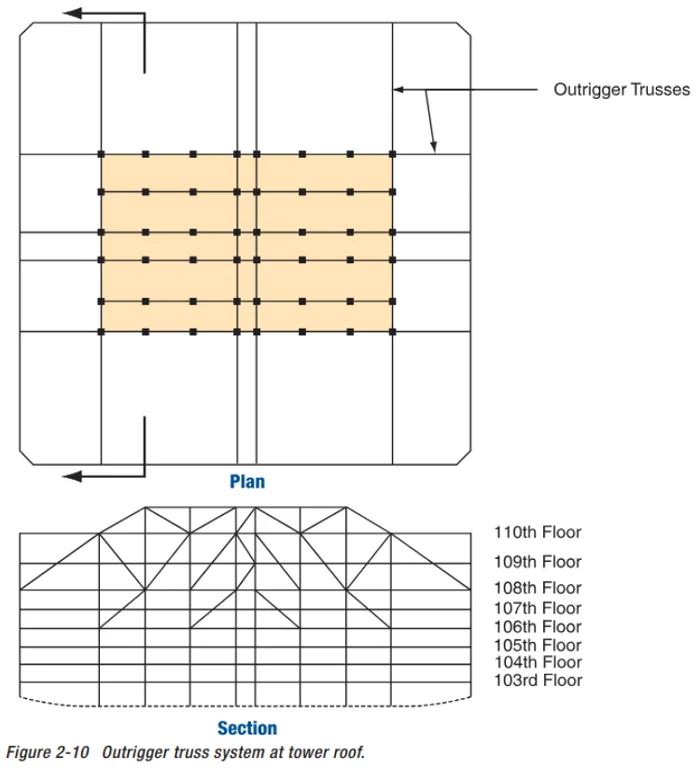
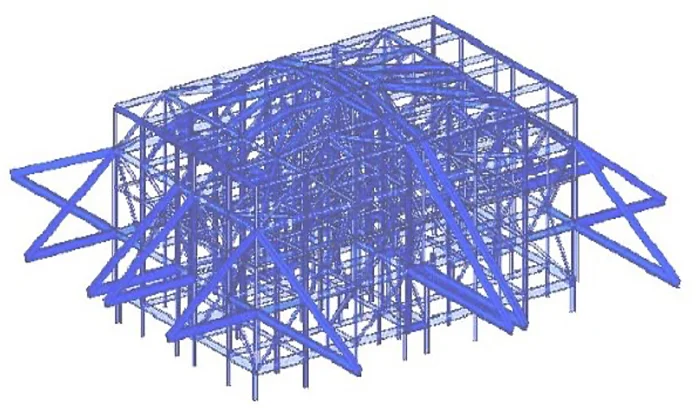
The hat truss is described in FEMA’s World Trade Center Building Performance Study: “Between the 106th and 110th floors, a series of diagonal braces were placed into the building frame. These diagonal braces together with the building columns and floor framing formed a deep outrigger truss system that extended between the exterior walls and across the building core framing. A total of 10 outrigger truss lines were present in each building (Figure 2-10), 6 extending across the long direction of the core and 4 extending across the short direction of the core. This outrigger truss system provided stiffening of the frame for wind resistance, mobilized some of the dead weight supported by the core to provide stability against wind-induced overturning, and also provided direct support for the transmission tower on WTC 1. Although WTC 2 did not have a transmission tower, the outrigger trusses in that building were also designed to support such a tower.”[11]
Note that if the columns were to fail as described by NIST, starting with the south wall perimeter columns and propagating through the core columns, one would expect the antenna and hat truss to tip as a unit. If, on the other hand, the antenna dropped into the building as the initial motion, either the hat truss or the columns supporting it would have to fail. No mechanism for such a failure, other than explosive charges, has been proposed.
Appendix B
The horizontal camera angle, measured from a line from the base of the antenna through the center of the north face of the building, is here calculated using GeoGebra. For the “Main & Ballou 17” video, both edges of the building are visible in at least some of the frames. (In other frames, the left edge of the building is obscured by smoke, but since we know the antenna is in the center of the roof, the location of the left edge of the building can be inferred.)
To perform the graphical calculation, a square is constructed using an automated polygon tool in GeoGebra, determined by two adjacent vertices (the blue dots on the square in Figure 8) which we place on the NE and NW edges of the building. By sliding those two defining corners along the vertical lines marking the edges of the building, the square is automatically resized and reoriented. The square is adjusted until a third corner lands precisely on the SE edge of the building. This is not a classical “compass and straightedge construction,” but high precision is obtainable with this tool when it is zoomed in. Once positioned, the square represents the top view of the building “folded” down onto the front view. The desired angle can then be directly measured. It turns out to be 55.24°.
Appendix C
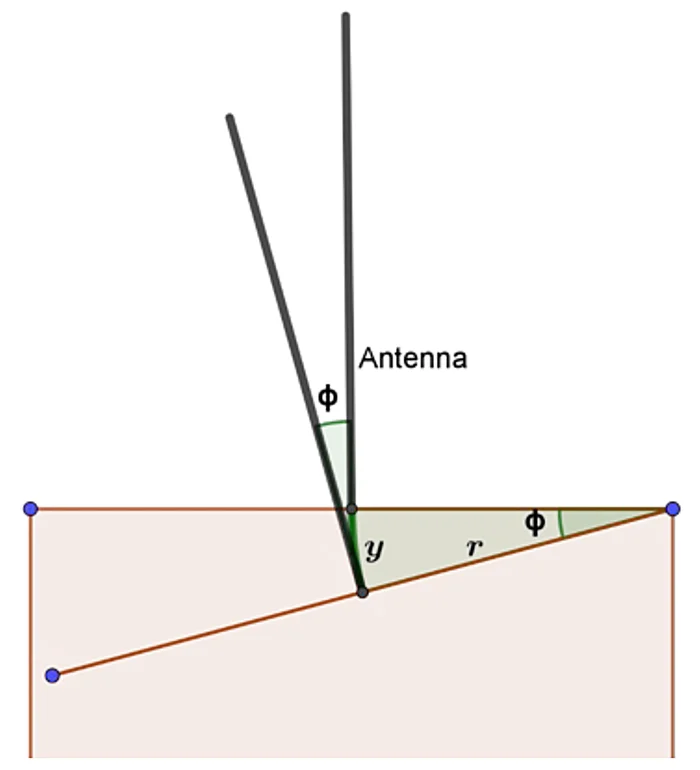
A transformation is needed to convert the antenna’s apparent angle of tilt on the film plane of a distant camera (θ), to the antenna’s true angle of tilt in its plane of rotation (ϕ) toward the south face of the building. The actual and apparent tilt of the antenna are in two different planes, so we have a 3-dimensional trig problem to solve.
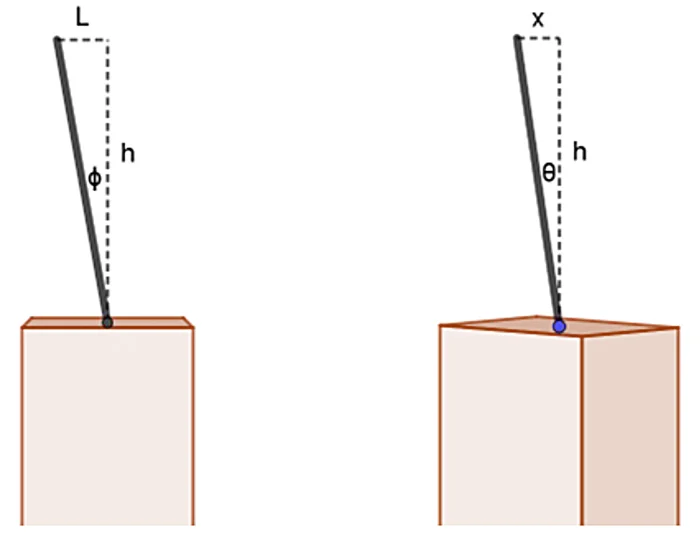
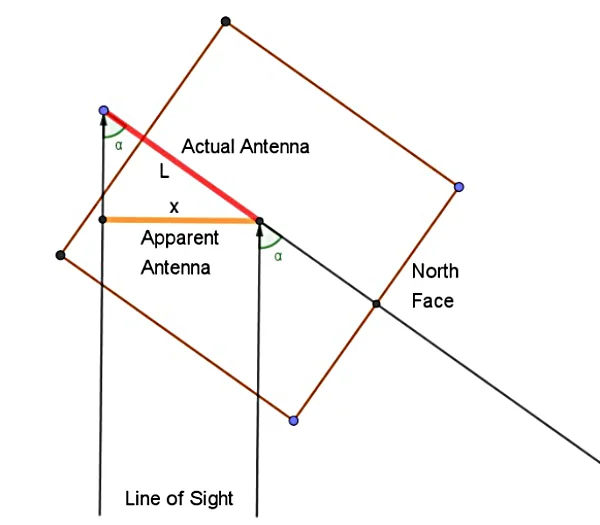
Figure 10 shows a bird’s-eye view from above the top of the building. The diagonal line on the drawing (top left to bottom right) indicates a nominal north-south line through the centers of the north and south faces of the building. The parallel arrows pointing upward from the bottom of the drawing, indicate the line of sight from the distant camera. The southward motion of the antenna in its plane of rotation (marked “Actual Antenna,” L) is foreshortened in its projection onto the film plane (marked “Apparent Antenna,” x). The angle α is the angle in the horizontal plane from the camera to nominal north. For the “Main & Ballou 17” video, we found this angle to be 55.24° in Appendix B.
To help with this 3-dimensional visualization, place Figure 5 horizontally on a table and place the eraser end of a vertical pencil on the center of the square in Figure 5 pointing upward. This represents the antenna. Now rotate (tilt) the pencil a little to the “south” (which would be to the upper left in the drawing) until the tip of the pencil is above the end of the red line. The red line segment on the drawing represents the horizontal component of the tilted antenna and the distance from the table up to the tip of the pencil represents the vertical component, which we call h. Note that the horizontal component L, the vertical component h, and the tilted antenna itself form a right triangle (as shown on the left in Figure 4). The small acute angle in this triangle we will call the tilt angle, ϕ.
Now picture this arrangement from the side, as indicated by the “line of sight” arrows in the diagram. This is the point of view of the distant video camera The vertical triangle we just described is projected onto a plane perpendicular to our line of sight. The height h, remains the same. The other two sides of the triangle are foreshortened. Instead of L, the base of this triangle is the orange length labeled x. (The hypotenuse is also foreshortened, but that length doesn’t enter into the calculation, so we can ignore it.) The acute angle at the base of this right triangle we will call the apparent tilt angle, labeled θ. The equations relating our variables are as follows:
tan θ = x / h
tan ϕ = L / h ==> h = L / tan ϕ
sin α = x / L ==> x = L sin α
Substituting expressions for h and x into the first equation we have:
tan θ = L sin α tan ϕ / L.
Cancelling L and rearranging, we have:
tan ϕ = tan θ / sin α
This gives us the actual angle of tilt, ϕ, in terms of the apparent angle of tilt, θ, which we measure on the video, and the camera angle, α, which we measured in Appendix B.
Appendix D
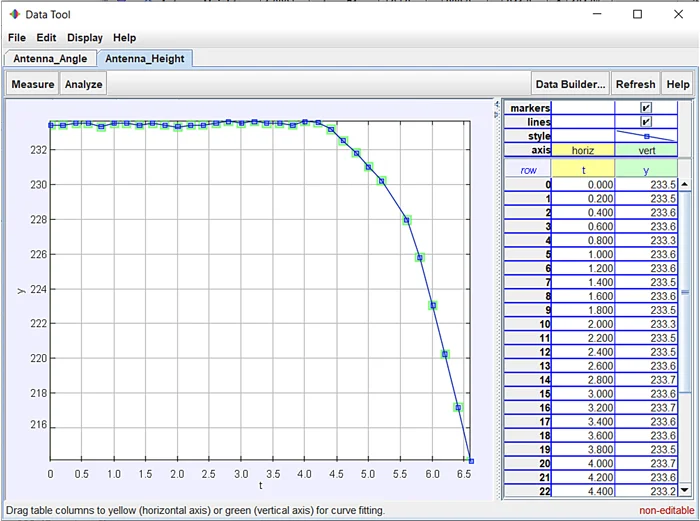
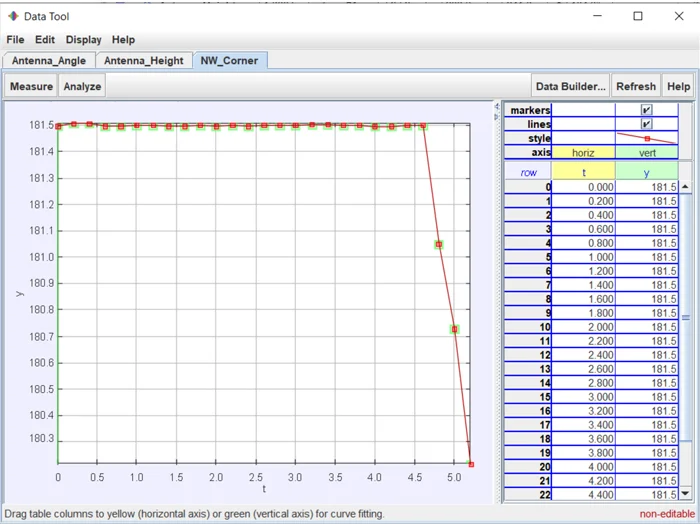
Using the Tracker program, we measure the height of the north face perimeter wall (measured at the NW corner), the height of the antenna, the apparent tilt of the antenna as a function of time.
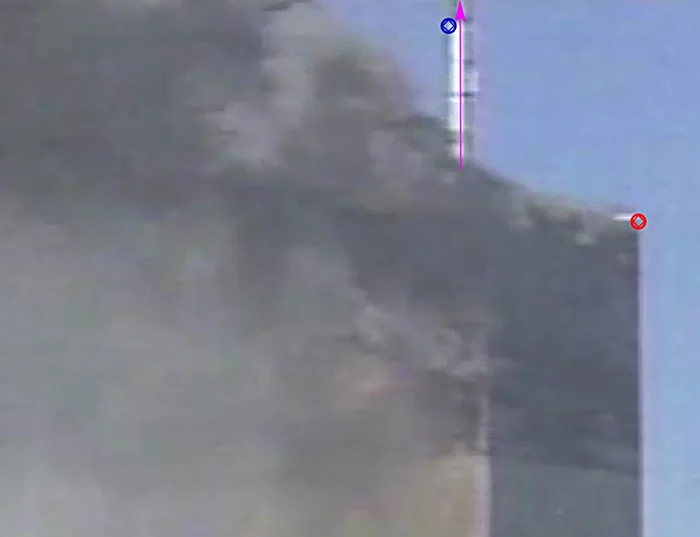
The height measurements do not have a common origin: they are used to determine relative motion only. The camera angle measured in Appendix B and the transformation derived in Appendix C are used to find the Actual Tilt, which is recorded in the last column. The row of “?” marks denote missing data, due to someone walking in front of the camera. The colored cells mark the transitions in the antenna and roof to downward motion, with the first highlighted cell indicating the zero point for the motion. From time 0 to 4 sec we would expect the tilt to remain constant, nominally zero, but there appear to be some small variations. I am interpreting the variations as noise in the measurement process. Note that the antenna starts downward at t = 4.0 sec whereas the roofline starts downward at t = 4.6 sec, a head start of 0.6 sec. During the first 1.6 sec of the antenna’s downward motion the tilt of the antenna rotates only 0.58°.
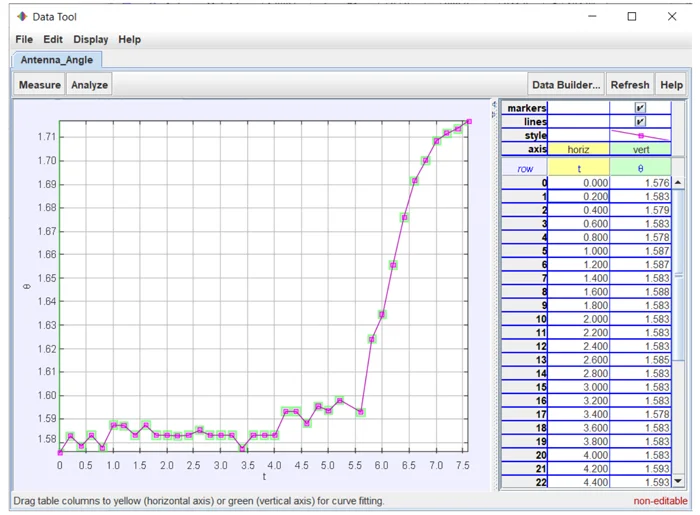
The graphs show the individual measurements of apparent tilt, antenna height, and roof height as functions of time taken from the data in the table.
Table 1: Tracker measurements.
| Roof Height | Antenna Height | Apparent Tilt | Actual Tilt | |
| t (sec) | y (m) | y (m) | θ° | ϕ° |
| 0.00 | 181.50 | 233.46 | 0.28 | 0.35 |
| 0.20 | 181.51 | 233.46 | 0.69 | 0.85 |
| 0.40 | 181.51 | 233.57 | 0.45 | 0.55 |
| 0.60 | 181.50 | 233.57 | 0.71 | 0.86 |
| 0.80 | 181.50 | 233.34 | 0.41 | 0.49 |
| 1.00 | 181.50 | 233.57 | 0.96 | 1.16 |
| 1.20 | 181.50 | 233.57 | 0.94 | 1.15 |
| 1.40 | 181.50 | 233.46 | 0.71 | 0.86 |
| 1.60 | 181.50 | 233.57 | 0.96 | 1.17 |
| 1.80 | 181.50 | 233.46 | 0.71 | 0.86 |
| 2.00 | 181.50 | 233.34 | 0.71 | 0.86 |
| 2.20 | 181.50 | 233.46 | 0.69 | 0.83 |
| 2.40 | 181.50 | 233.45 | 0.71 | 0.86 |
| 2.60 | 181.50 | 233.57 | 0.83 | 1.01 |
| 2.80 | 181.50 | 233.68 | 0.71 | 0.86 |
| 3.00 | 181.50 | 233.57 | 0.71 | 0.86 |
| 3.20 | 181.50 | 233.68 | 0.71 | 0.86 |
| 3.40 | 181.50 | 233.57 | 0.39 | 0.47 |
| 3.60 | 181.50 | 233.57 | 0.71 | 0.86 |
| 3.80 | 181.50 | 233.45 | 0.71 | 0.86 |
| 4.00 | 181.50 | 233.68 | 0.71 | 0.86 |
| 4.20 | 181.50 | 233.34 | 1.29 | 1.57 |
| 4.40 | 181.50 | 233.22 | 1.29 | 1.57 |
| 4.60 | 181.50 | 232.54 | 0.99 | 1.21 |
| 4.80 | 181.05 | 231.86 | 1.42 | 1.73 |
| 5.00 | 180.73 | 231.05 | 1.31 | 1.59 |
| 5.20 | 180.22 | 230.25 | 1.57 | 1.91 |
| 5.40 | ? | ? | ? | |
| 5.60 | 227.97 | 1.27 | 1.55 | |
| 5.80 | 225.81 | 3.05 | 3.71 | |
| 6.00 | 223.08 | 3.65 | 4.44 | |
| 6.20 | 220.25 | 4.86 | 5.91 | |
| 6.40 | 217.18 | 6.03 | 7.33 | |
| 6.60 | 214.12 | 6.92 | 8.41 | |
| 6.80 | 7.42 | 9.00 | ||
| 7.00 | 7.90 | 9.59 | ||
| 7.20 | 8.08 | 9.81 | ||
| 7.40 | 8.20 | 9.95 | ||
| 7.60 | 8.39 | 10.18 |
Apparent Antenna Angle vs. Time
Regression for Initial Antenna Rotation
Antenna height vs time
Roof height vs time, measured at the NW corner of the building.
Appendix E
The antenna displays a combination of rotation and downward translation, as shown in Table 1 and Figures 12-15. In the first 1.6 sec of descent, from 4.0 to 5.6 sec, the antenna descends 5.71 m but rotates only 0.58°, or 0.01 radians. (If the roof had descended 5.71 m due to pure rotation of the roof pivoting at the edge of the roofline, the rotation of the antenna would have been 10.28°.) Let us hypothesize that the observed downward translation of the antenna is actually the vertical component of the rotation of the roof-antenna complex. To a very close approximation that would be the arc length of the rotation of the roof.
We have found that for the initial 1.6 sec of motion, the radian measure of the rotation angle would be 0.01. Multiplying this by the maximum possible radius (32 m) gives an arc length of 32 cm. However, the measured vertical motion of the antenna over this same interval is 5.71 m. Therefore, we can conclude that a rotation of the roof-antenna complex cannot account for the drop of the antenna. The vertical drop of the antenna is therefore real, not an illusion.
References
- https://www.youtube.com/watch?v=ZjSd9wB55zk
- https://ic911.org/journal/articles/why-indeed-did-the-wtc-buildings-completely-collapse-2/
- https://www.ae911truth.org/evidence/technical-articles/articles-by-ae911truth/140-25-areas-of-specific-concern-in-the-nist-wtc-reports
- https://ic911.org/journal/articles/the-missing-jolt-a-simple-refutation-of-the-nist-bazant-collapse-hypothesis-2/
- Ryan Mackey in Mackey/Szamboti debate: https://www.youtube.com/watch?v=kDvDND9zNUk&t=452s
- https://www.youtube.com/watch?v=mDvxw8u2avo
- Video by Etienne Sauret showing initiation of collapse of the North Tower: https://www.youtube.com/watch?v=xGAofwkAOlo
- “Main & Ballou 17”: https://www.youtube.com/watch?v=51mUua8veUk
- GeoGebra is free for non-commercial use and can be downloaded from https://GeoGebra.org.
- Tracker is free, open-source software: https://www.compadre.org/osp/webdocs/Tools.cfm?t=Tracker
- World Trade Center Building Performance Study, Pp 2-5, 2-10, available from mirror site https://911research.wtc7.net/mirrors/fema_wtc/index.html
Author’s background and affiliations: retired physics teacher; coordinator of Scientists for 9/11 Truth; board member of the International Center for 9/11 Justice.