Editor’s Note: This Discussion Paper was rejected by the Journal of Structural Engineering on the grounds of “insufficient technical content.” We do not agree with that assessment. Mathematical models such as the one proposed by Le and Bažant must match basic observations of the event to be valid, and this Discussion provides straightforward observations that do not match the mathematical model. We urge our colleagues at the Journal of Structural Engineering to reverse their decision and publish this Discussion in the same journal where the Technical Paper still sits uncorrected.
The destruction of the World Trade Center (WTC) Twin Towers on September 11, 2001, was highly documented relative to other building failures, with video and photographic evidence taken from several directions available for analysis.
It is agreed that the National Institute of Standards and Technology (NIST) did not address the entire collapse process in its investigation, analyzing only up to the point that “the conditions for collapse initiation were reached” (NIST 2005). It is also agreed that both downward motions as well as lateral ejection of debris can be observed during the collapses.
In the Technical Paper, Le and Bažant described a mathematical model of the collapses involving two phases: “crush-down,” where a crush front propagates downward crushing the lower part of the tower, followed by “crush-up,” where the upper falling part of the tower hits compacted debris on the ground, causing the crush front to propagate upward destroying the upper part.
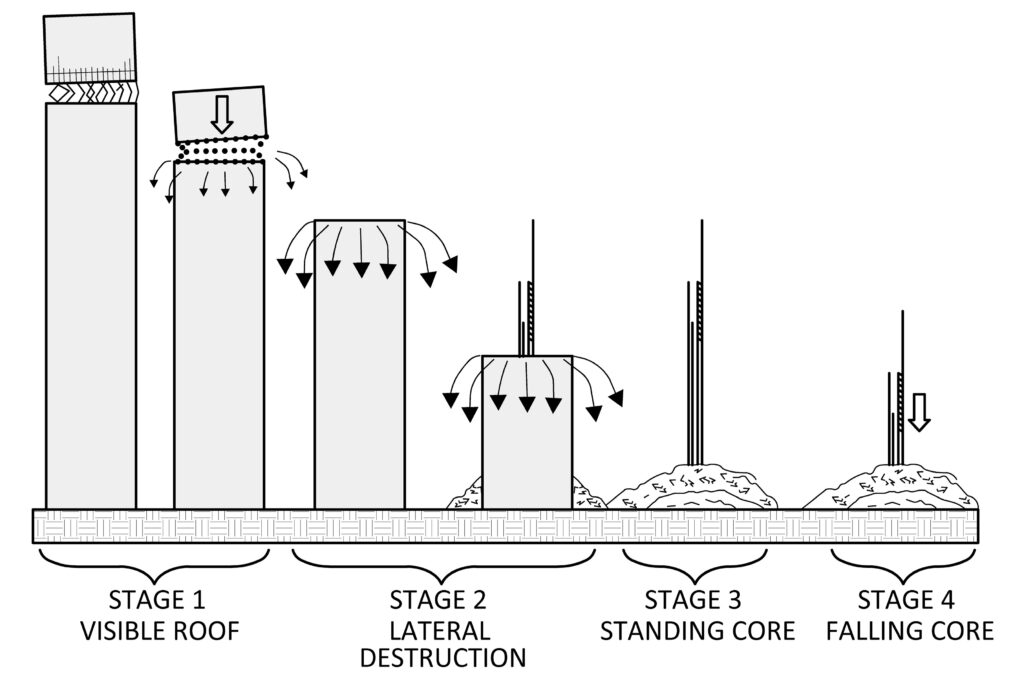
Using Video S1 (Federal Bureau of Investigation 2001), which shows the North Tower’s destruction, four stages of the entire collapse process can be readily observed rather than the two phases described by the authors. Video S2 (Brown 2001) was used to confirm the measurement and characterization of the four distinct stages.
Stage One – Visible Roof (0-3 seconds)
This stage is consistent with the initial phase described in the Technical Paper. It is agreed that the motion of the upper falling part during these first three seconds is the only stage where the roofline can be observed. However, the height of the falling upper part is diminished significantly each second of this stage. The two primary motions observed are both downward and lateral.
Stage Two – Lateral Destruction (3-13 seconds)
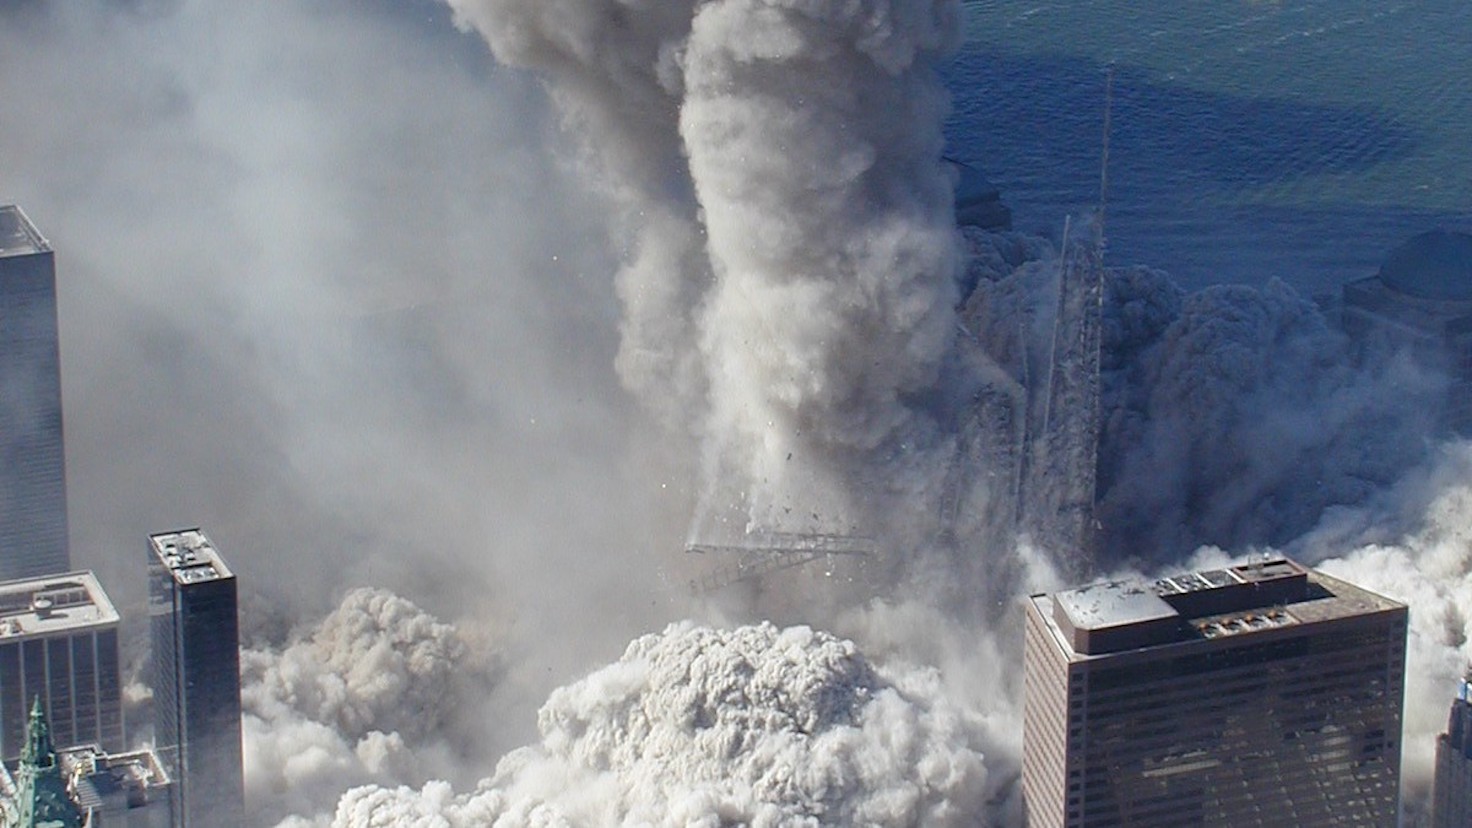
This stage is similar in duration to the crush-down phase in the Technical Paper, except no evidence of the upper part or roof can be seen in the many videos and photos of the event. A significant amount of building material is propelled laterally. Importantly, inner core columns that remain standing can be observed in the latter part of this stage while building material continues to be propelled laterally. However, the conclusion of this stage is not the conclusion of the entire collapse process since significant portions of the tower have yet to fall.
Stage Three – Standing Core (13-27 seconds)
After the roof and perimeter of the structure is down, many inner core columns remain standing, with some falling away, unbent (Public Broadcasting Service 2001, Peskin 2001, Semendinger 2001).
A remaining unbent group of inner core columns stands for a significant time. The photograph taken by Lyle Owerko (permission granted) presented in Fig. 1 clearly shows this group of inner core columns. Since the roof (or its fragments) fell in Stage Two, the highest point of the tower is now represented by the standing core columns. No downward nor lateral ejection of debris is observed for the entire duration of Stage Three.

The upper part and roof system could not have passed down through the standing core structure and remained intact. Since the upper part could not pass down through the standing core structure intact, then its components could not have acted as a unified mass, invalidating the underlying assumptions of the Technical Paper.
Le and Bažant suggested the upper part was obscured by dust clouds after the first few seconds. However, given the large quantity of video and photographic evidence from many angles showing no upper part whatsoever as well as the existence of the standing core structure, it is likely that the upper part was fragmented prior to any crush-up phase rather than simply obscured by dust clouds. The still-standing core column structure in Stage Three would also inhibit any crush-up phase.
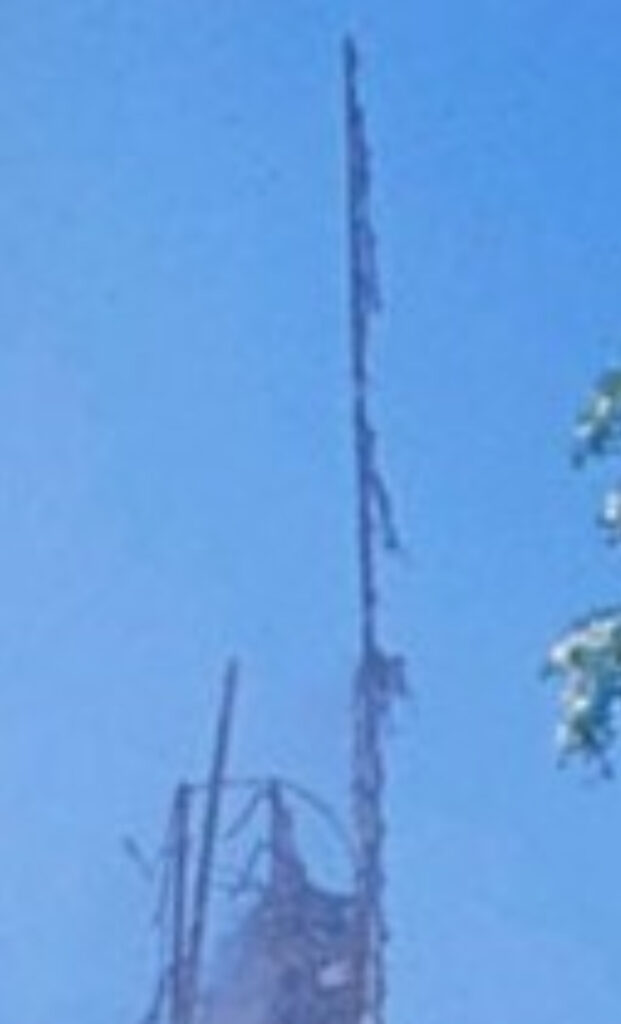
There is a particularly tall core column at the top of the standing core group shown in Fig. 2. What was once a braced column is now unbraced, with its top free during this stage, resulting in a much longer effective length. Because of the large slenderness ratio, the downward force on it must have been significantly less than its design capacity during Stage Two of the collapse process, or the column would be buckled and bent. Therefore, there could not have been any significant downward force imposed by any falling upper part or roof system on that column, nor on the other free-standing group of core columns.
Stage Four – Falling Core (27-30 seconds)
After remaining vertical for a significant time, the core column structure suddenly falls straight down, rather than tipping. The core column structure falls for about three seconds before being obscured from view. The Technical Paper did not address the straight-down fall of this core column structure.
South Tower Standing Core Structure
It should be noted that a remaining group of inner core columns can also be observed during the collapse of the South Tower, though it is relatively obscured by dust clouds (Skidmore, Owings & Merrill 2001). This group of columns stands for approximately 21 seconds into the collapse process before apparently falling straight down, exhibiting similar behavior to the remaining group of core columns of the North Tower that began to fall 27 seconds into the collapse process.
Schematic Representation of the Collapse Process
The Technical Paper included a “Schematic of the collapse process of WTC towers.” The schematic omitted the latter two stages of the entire collapse process. In addition, it did not indicate the standing inner core structure. A more accurate representation of the entire collapse process is shown in Fig. 3.
Comparison with Observations
The Technical Paper only compared its model results during the first few seconds, assuming the dust clouds subsequently obscured the upper part from view. It omitted observation comparison for the majority of the collapse process and did not consider that the upper falling part could not have passed through the standing core structure and remained intact.
Similarly, the Technical Paper’s graph entitled “Motion histories of the towers for the entire collapse duration” did not include the motion history of the entire collapse duration of approximately 30 seconds. Since the standing core structure and its subsequent fall were omitted, any claim of the modeling representing the entire collapse duration is inaccurate, invalidating the current mathematical model. A more realistic motion history graph for the entire collapse is presented in Fig. 4.
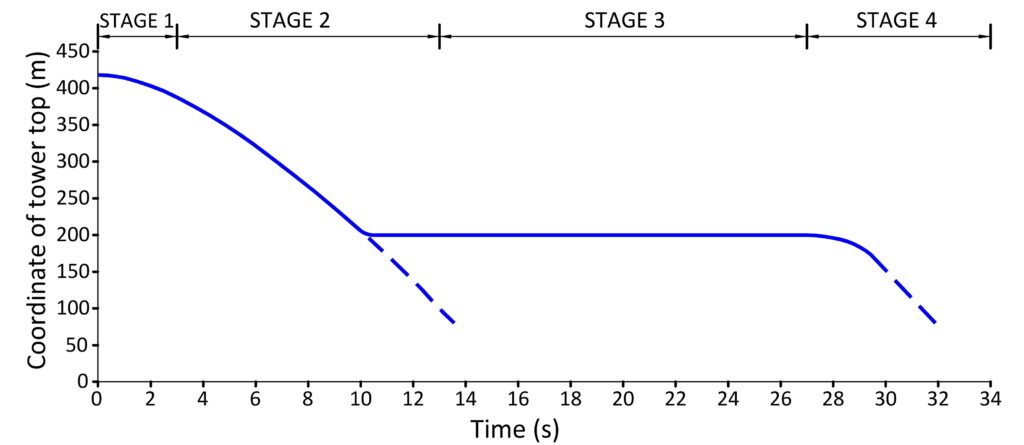
If the crush-down crush-up model is to be used to explain the fall of the WTC towers and progressive collapses in general, then further study is necessary to address the entire collapse duration and the motions observed.
References
Le, Jia-Liang and Bažant, Zdeněk. 2022. Spontaneous Collapse Mechanism of World Trade Center Twin Towers and Progressive Collapse in General. Journal of Structural Engineering. April 2022, Volume 148, Issue 6. https://ic911.org/wp-content/uploads/2023/08/624.pdf
NIST, 2005. Final report on the collapse of the World Trade Center towers. 82. Gaithersburg, MD: National Institute of Standards and Technology
Peskin, Richard. 2001. “Peskin 25.avi.” Accessed in the NIST Disaster and Failure Studies Repository on August 30, 2022. https://drive.google.com/drive/folders/1RvdRrgxWc93-lrgW8IdbkK5TLZmuWQnF
Public Broadcasting Service. 2001. “The Center of the World: New York: A Documentary Film.” PBS- Center 47.avi. Accessed in the NIST Disaster and Failure Studies Repository on August 30, 2022. https://drive.google.com/drive/folders/1U9imdt0Yz9IlNcVmx86nVvXezYWYS4a6
Semendinger, Greg. NYC Police Aviation Unit. 2001. “gj-wtc30.JPG.” Accessed in the NIST Disaster and Failure Studies Repository on August 30, 2022. https://drive.google.com/drive/folders/1xjVq_E6ymD58XUeUEnKkxbcYP6mjM780
Skidmore, Owings & Merrill. 2001. “Skidmore Clip 7.avi.” At 0:36 to 1:01. Accessed in the NIST Disaster and Failure Studies Repository on August 30, 2002. https://drive.google.com/drive/folders/1LKOqORQXP4QM6K64IVViFGWbK3iVBa-z
Supplemental Materials
Video S1. Federal Bureau of Investigation. 2001. “WTC1-FBI-#7-606.avi.” At 39:54. Accessed in the NIST Disaster and Failure Studies Repository on August 30, 2022. https://drive.google.com/drive/folders/1UkPCc1UfDmyCYkq6e-5mY_-8nhAqAhDM
Video S2. Brown, Barry. 2001. “North Tower Collapse.” Provided by creator.

